Replace traditional paper forms with digital workflows.
View your data in real-time, exactly how your teams want it.
Streamline non-conformance handling with custom workflows.
Automate your schedules and enjoy a live view of your operations.
Centralise your documentation and make it available effortlessly.
Make QualityApp work seamlessly as part of your business.

Build compliance into your processes by default and monitor with ease.
Empower your teams to make data-driven decisions.
Manage PPE, asset logs and follow-up actions all in one tool.
Get real insight into your supplier performance, in real time.
Set up and manage your hygiene processes all from one tool.
Streamline HSE with digital workflows for near misses and accidents.
How to Build Custom Dashboards and Reports in QualityApp
In food manufacturing, having access to real-time data is essential for a safer and more efficient operation. It allows your teams to make smarter decisions and ensure compliance at every stage of the production process.
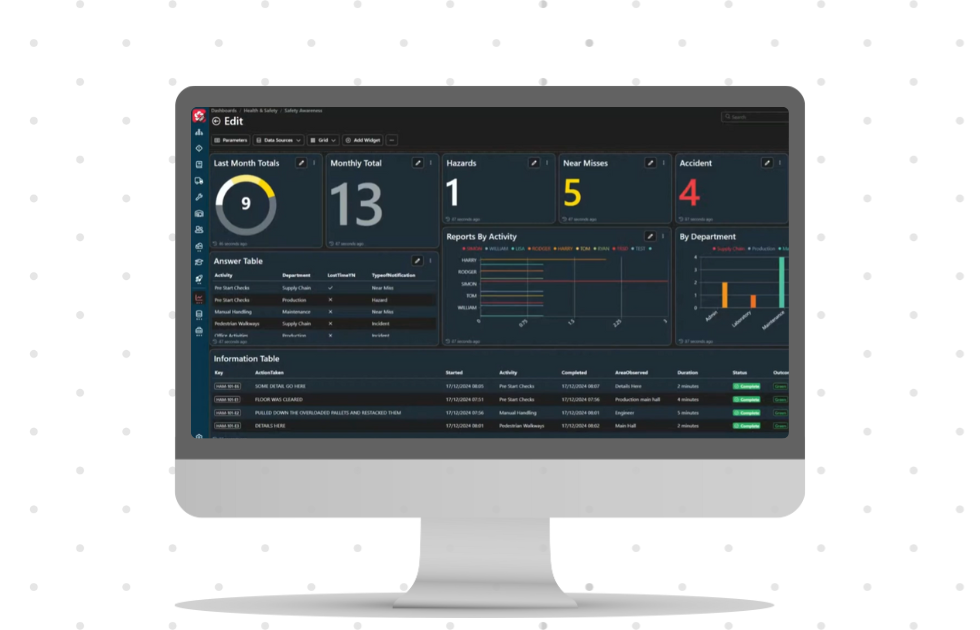
With QualityApp's intuitive dashboard designer, you can create custom dashboards to visualise the data that you need to see, exactly how you want to see it.
In this short demo video, we show how to build a tailored dashboard using QualityApp’s intuitive drag-and-drop tools. You'll see just how easy it is to visualise live operational data, generate automated reports, and keep teams aligned, from factory floor to management.
Unlock Real-Time Operational Insights with Dashboards & Reports
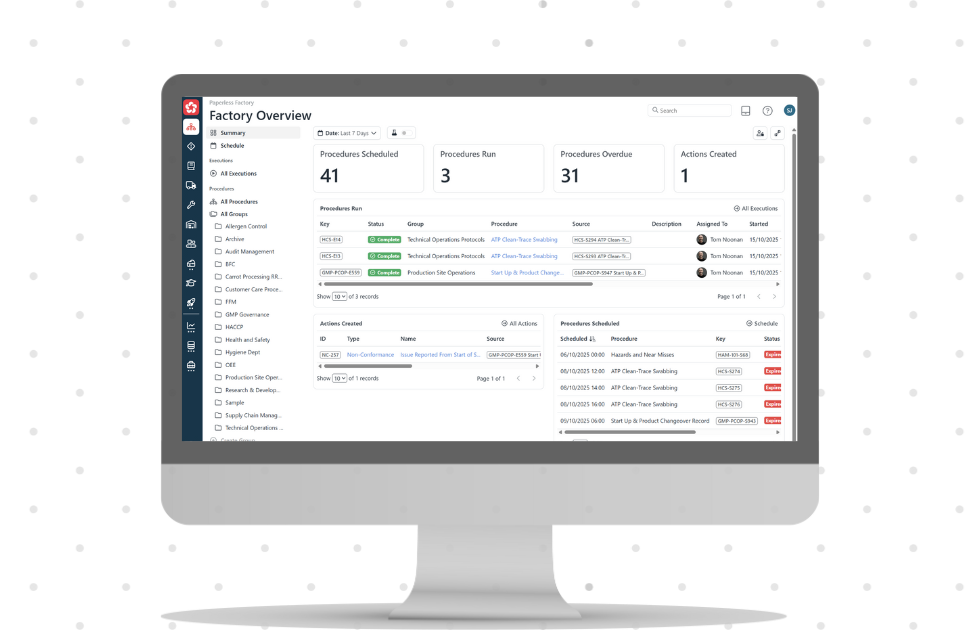
The dashboards in QualityApp provide interactive visual displays of your factory’s live performance data. Whether you’re tracking hygiene compliance, production KPIs, or non-conformance trends, the dashboards ensure the right data is available at the right time and in the right format.
They work seamlessly across desktop, tablet, and mobile devices, so your insights are always within reach, wherever you are.
With the report builder, you can create paginated reports and set up email subscriptions to deliver updates directly to each team’s inbox. Reports can also be triggered automatically through procedures and workflows. For example, every morning at 9 a.m., the Quality Team receives the previous day’s metal detection report.
Key Features Demonstrated in the Demo Video
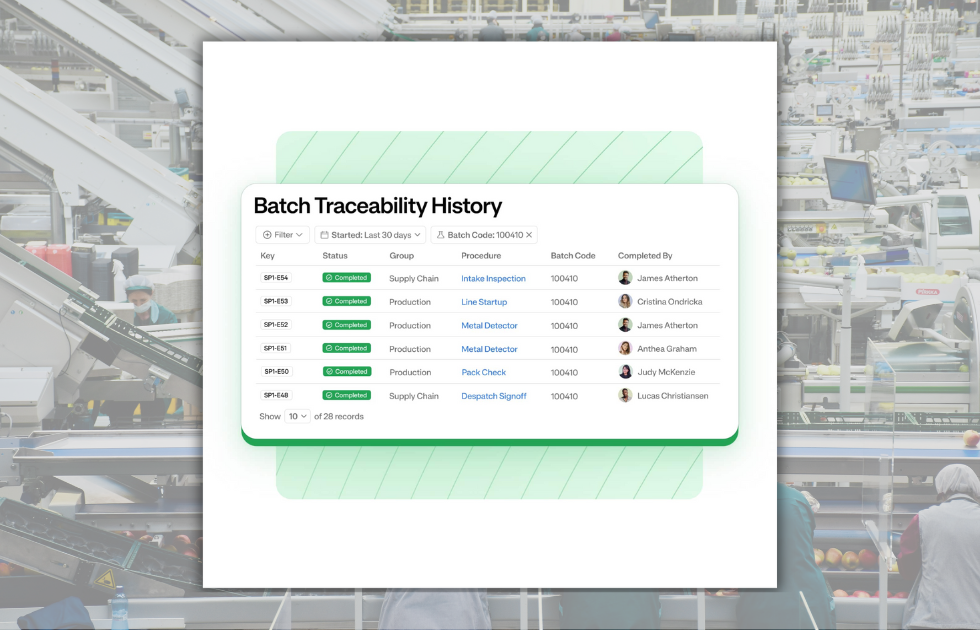
Multi-Source Data Integration
Easily combine and visualise different data streams in one place. Pull data from multiple internal and third-party systems including:
- Procedures and actions from QualityApp
- Internal datasets and queries
- External APIs or connected systems
Intuitive Dashboard Designer
Create and customise dashboards in minutes using our no-code design tools:
- Drag-and-drop layout builder
- Real-time data preview
- Prebuilt widgets and visualisations (bar, line, pie, KPIs, tables)
Export & Share with Ease
- Export full dashboards or individual widgets as PDFs or image files
- Share insights with external stakeholders instantly
- Set permissions so each team sees only what they need
Built-In Report Designer & Scheduling
Go beyond dashboards with paginated reports that can be:
- Automatically generated on a schedule
- Triggered by workflows (e.g. after a procedure is completed)
- Delivered directly to inboxes across departments
Whether it’s daily quality summaries or weekly compliance overviews, you can automate it all.
Smart Email Subscriptions
Never miss a report again. Set up email subscriptions for any dashboard or report:
- Choose the recipients
- Define frequency (e.g. every Monday at 9 AM)
- Automatically email reports to the right people at the right time
Why Real-Time Data Matters in Food Manufacturing
Access to accurate, up-to-date information is essential for maintaining safety, quality, and efficiency in high-pressure production environments.
With QualityApp’s Dashboards & Reporting, you can:
- Spot and resolve issues faster
- Ensure compliance with audit-ready data trails
- Reduce manual reporting time
- Drive accountability with visibility across all departments
- Make data-driven decisions daily
Built for Continuous Improvement
Like all modules in QualityApp, the Dashboard and Reporting Suite is designed for scalability and self-service. As your operations evolve, your dashboards and reports can be updated directly by your team. No coding or costly upgrade required.
Ready to see power of data in your food factory?
Book a demo today and see how real-time insights can drive better outcomes across your operation.
Start your digital transformation today
Join the many businesses driving efficiency and compliance with QualityApp. Arrange a demo today to experience the future of quality management.
